Yes, each team can have separate dashboards with data specific to their use cases.
iFlowHive
Solution Details
Overview
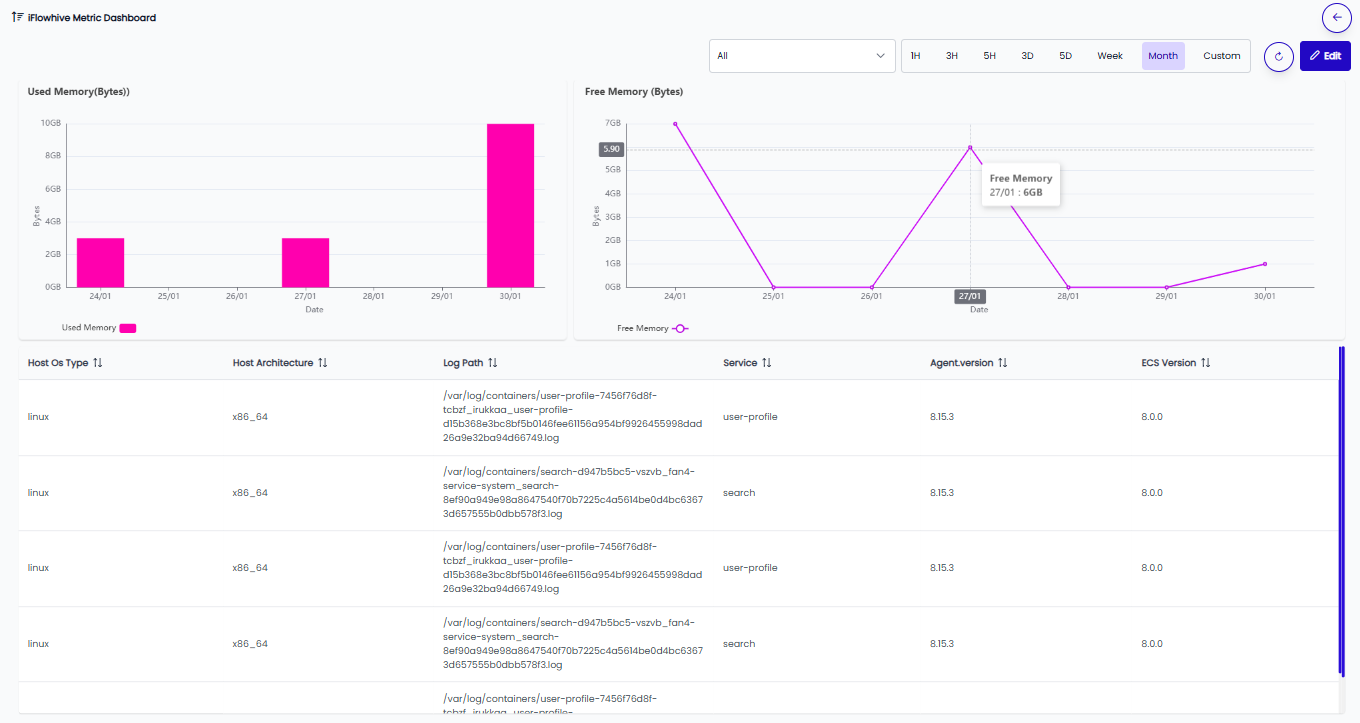
iFlowHive provides highly customizable dashboards that allow users to choose data sources, chart types, and configure real-time visualizations. Like alerts, dashboards can be customized at the asset level, ensuring each team gets relevant insights. To minimize setup time, iFlowHive ships with predefined dashboard templates that organizations can enable or modify as needed.
Fully Customizable Dashboards
Users can:
- Choose their own data sources (logs, metrics, alerts, system events).
- Select the visualization type (Bar Chart, Pie Chart, Stack Chart, Grid View, Counters).
- Apply custom filters & labels to modify colors, labels, and thresholds.
Asset-Level Dashboard Configuration
IT Admins and Application Admins can enable or disable specific dashboards per asset. Organizations can define unique dashboard views for different services, departments, or teams.
Pre-Built Standard Dashboards
iFlowHive ships with ready-to-use dashboards covering common monitoring needs. Organizations can modify or extend these dashboards to suit their specific requirements.
Real-Time Updates & Drill-Down Capabilities
Dashboards auto-refresh to display live data insights. Users can drill down into alerts, logs, and metrics directly from the dashboard.
Benefits
Customized Insights for Each Team
Different teams can have custom dashboards with relevant metrics.
Faster Decision-Making
Data is visualized in real-time with user-defined thresholds.
Less Configuration Effort
Pre-built dashboards help organizations get started quickly.
Granular Control
Admins can enable or disable dashboards at the asset level, reducing clutter.
Frequently Asked Questions
-
Can we create different dashboards for different teams?
-
Can I use multiple data sources in a single dashboard?Yes, dashboards support multiple data sources, allowing you to combine metrics, logs, and events in one view.
-
Are the dashboards updated in real-time?Yes, dashboards auto-refresh based on live data streams.