Yes, iFlowHive allows multiple customized dashboards for different teams. For example, IT teams can track server health, while business users monitor KPIs related to operational efficiency.
iFlowHive
Solution Details
Overview
Understanding the health and performance of an organization’s IT and IoT infrastructure requires more than just basic monitoring—it requires deep visibility and contextual insights. iFlowHive’s customizable dashboards with drill-down views allow organizations to track high-level system status while offering the ability to dig deeper into individual components, logs, and metrics in real time.
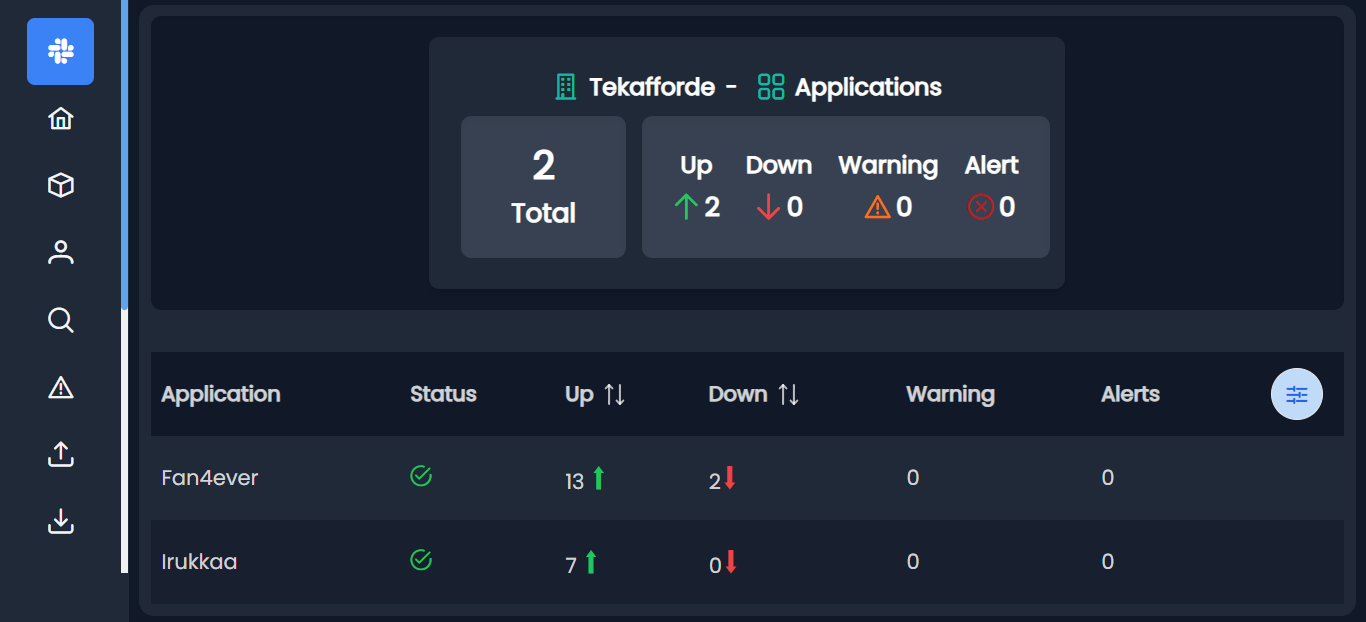
Unlike traditional dashboards that only present static graphs and basic metrics, iFlowHive provides a multi-layered approach where users can start at an organization-wide overview and drill down into specific applications, services, or infrastructure components. This means IT and business teams can quickly diagnose issues, identify trends, and make data-driven decisions without needing to manually filter through multiple monitoring tools.
The dashboards also feature real-time Red/Amber/Green (RAG) status indicators, customizable widgets, and advanced filtering to ensure that users only see the most relevant data for their role and responsibilities. Whether you are monitoring application uptime, network latency, API performance, IoT sensor activity, or infrastructure bottlenecks, iFlowHive’s dashboards provide complete control over your data visualization.
Hierarchical Drill-Down Views
Start with high-level organization-wide insights and navigate down to individual applications, services, databases, or network devices.
Real-Time Status Indicators
Uses Red/Amber/Green (RAG) indicators to quickly assess system health and performance trends.
Customizable Dashboard Widgets
Choose from line charts, bar charts, pie charts, stack charts, grid views, counters, tables, and more.
Multi-Level Filtering & Tagging
Filter data based on teams, locations, applications, or infrastructure components to show only the most relevant information.
Live Data Refresh & Historical Trends
View both real-time metrics and historical performance trends for deeper analysis.
Multi-Source Data Visualization
Pull data from logs, metrics, alerts, APIs, ITSM tools, IoT connectors, and third-party monitoring systems.
Dark Mode & Custom Themes
Personalize dashboards with adjustable themes, colors, and layouts.
Role-Based Access Control (RBAC)
Ensure only authorized users can view or modify specific dashboards.
Benefits
Faster Root Cause Analysis
Enables teams to pinpoint performance issues by drilling down from system-wide metrics to granular logs.
Improved IT & Business Collaboration
IT teams can monitor infrastructure health, while business users can track operational KPIs from the same dashboard.
Custom Views for Different Teams
Each department (IT, DevOps, IoT, Security, Finance) can tailor dashboards to their specific needs.
Enhanced Decision-Making
By combining real-time and historical data, teams can predict performance trends and optimize system efficiency.
Reduced Alert Fatigue
Instead of receiving thousands of notifications, teams can visually assess system status using the intuitive RAG indicators.
Multi-Device Compatibility
Dashboards are accessible via desktops, tablets, and mobile devices, ensuring on-the-go monitoring.
Frequently Asked Questions
-
Can I create different dashboards for different teams?
-
Does the drill-down feature allow me to view logs directly from alerts?Yes, iFlowHive’s drill-down capability links alerts to the exact logs, metrics, or historical trends that triggered them, ensuring fast and effective troubleshooting.
-
Can I integrate third-party monitoring tools into the dashboards?Yes, iFlowHive supports integrations with ELK Stack, Grafana, Prometheus, AWS CloudWatch, Azure Monitor, and ITSM platforms like ServiceNow and Jira.
-
Can we customize the refresh rate for live data updates?Yes, you can configure dashboard refresh intervals, ensuring that data updates in real-time or at predefined intervals based on business needs.
-
Is it possible to set up alerts directly from the dashboard?Yes, alerts can be configured directly from dashboard visualizations, allowing users to set custom thresholds and notification rules for any monitored metric.
-
Does iFlowHive support dashboard export or reporting?Yes, iFlowHive provides PDF, CSV, and JSON export options, as well as automated reporting features for stakeholders.